


A Data Attribution & KPI Reporting Training Manual
 Data Attribution refers to the ability to connect pieces of data across multiple software platforms. The “attribution” is about knowing where each piece of data, called a “record,” comes from.
For Digital Reach, the software platforms we seek to connect are usually:
- Website Data Collectors (e.g. Google Analytics, Browser Cookies)
- Sales Data Collectors or CRMs (e.g. Salesforce, Hubspot, Microsoft Dynamics)
It’s important to note that Data Attribution makes the most sense for B2B marketing and sales organizations. For e-commerce transactions, the entire thing can be captured by website level data, including revenue, source, and medium, so revenue attribution is much simpler. The whole thing can live in Google Analytics (there are some applications for tracking e-commerce activity in the CRM, so Data Attribution isn’t meaningless here, but it solves a much larger problem on the B2B side).
B2B needs to connect the website to the CRM in order to process data. Here’s how that works.
Capturing Website-Level Data
Google Analytics works by applying a Cookie to a website visitor. This happens in a couple of different ways:
- UTM Tags (Urchin Tracking Module Tags)
- UTM tags are pieces of data appended to the end of a URL, that provide that data to Google Analytics via hidden tracking code on the page.
- There are five core pieces of UTM information (source, medium, campaign, content, keyword). A visitor to a URL like example.com/?utm_source=linkedin&utm_medium=social will, if the example.com page has the hidden tracking code, be recorded by Google Analytics as having come from Source = LinkedIn and Medium = Social. Then, we can report on traffic and behavior based on those source and medium parameters.
- Z-cookie information
- Z-Cookie records browser information without needing UTM tags. This is how Google Analytics knows if you came from an organic search, a referral, or via direct.
The Z-Cookie and UTM Tag information are sent to the website data collector (e.g. Google Analytics cookie, or another cookie) where they can be reported on.
However, this data is anonymous. It’s not possible to go into Google Analytics and see who exactly came to the website via LinkedIn Social. We don’t know whether or not that person was a qualified lead/buyer (i.e. someone who went on to become a customer) or someone who was completely unqualified. And, because our clients ONLY care about qualified traffic, reporting purely on general traffic information isn’t good enough for B2B clients.
Capturing CRM-Level Data
In order to know what exactly happened to our LinkedIn Social visitor, we need a few things:
- The visitor MUST submit a form of some kind on the page (this could be a blog subscription, a lead magnet form, etc.).
- That page MUST have an attribution pixel, like the DRA Attribution Pixel, in the page code.
- The form must be connected to a marketing automation software (e.g. Marketo, Autopilot, etc.) or directly to the CRM.
It is impossible to identify anonymous traffic without a form submission. So, if a client asks, the answer is always that it is not possible.
Reverse IP lookup IS possible, so we can use 3rd party software (like Kickfire or Demandbase) to make educated guesses about what company the visitor is from, but we cannot identify anonymous traffic exactly without a form submission.
Let’s say attribution works correctly
But, if the person does fill out the form, AND the DRA attribution pixel is on the page, the following things happen:
- The DRA attribution pixel’s cookie stores the UTM or Z-Cookie information, the exact same as the Google Analytics workflow described above.
- The DRA attribution pixel then creates “hidden fields” in the form. So, while the fields that the visitor actually sees might show just “Name, Email, Company, Title”, additional fields for “First-Touch Source”, “First-Touch Medium”, “Last-Touch Source”, and “Last-Touch Medium” had been created.
- Lastly, the DRA attribution pixel then pulls the cookie information and adds it to the form. So, the actual form submitted looks something like this:
- Name: John Doe
- Email: John.Doe@example.com
- Title: CEO
- Company: ExampleCo
- First-Touch Source: LinkedIn
- First-Touch Medium: Social
- Last-Touch Source: LinkedIn
- Last-Touch Medium: Social
- Plus the remaining attribution fields
- The DRA attribution pixel gathers first and last touch for following data:
- Source
- Medium
- Campaign
- Content
- Keyword
- Landing Page
- Timestamp
- The DRA attribution pixel gathers first and last touch for following data:
- Plus the remaining attribution fields

Then, assuming that the form is connected to the marketing automation or CRM, the entire set of data listed above gets sent into the CRM. Now, we know that it was John Doe who arrived via LinkedIn Social. And, we can report on what happens with John in the CRM – if he became a customer who spends $10,000, we can then attribute that $10,000 to the LinkedIn Source and the Social Medium.
As part of the connection between the form and the marketing automation/CRM software, there MUST be fields in the MA/CRM to hold the data. The same way that the CRM has a field called “Name” which receives and holds the value “John Doe”, the CRM must also have a field called “First-Touch Source” to receive the value “LinkedIn”. If that field does not exist, the form will try to send that piece of data but, lacking any place for it to go, that piece of data will disappear and be lost.
You may notice that, in the hidden form example above, both “First Touch” and “Last Touch” values are the same. You might be worried that this could cause problems, but it’s actually very simple:
- If the lead is net-new, then both their First and Last touch data will be the same. This form submission was simultaneously their first submission AND their most recent submission.
- But, what if the lead is NOT net-new?
- The “First Touch” fields in the CRM are set to disallow overwriting if a value already exists. So, the form submission data will try to overwrite the existing data, but will be denied by the CRM. So, all of the “Last Touch” fields will overwrite with new data, but the first-touch fields will remain the same.
DRA utilizes something called a “Salesforce Package”, which allows a Salesforce admin to click a button and create all of the necessary fields required to hold the attribution data captured by the hidden fields. For other, non-Salesforce, CRMs, these fields may need to be added manually.
Lastly, CRMs have different sections, or “objects” to track different sorts of information. The most common ones we work with are Leads, Contacts, and Opportunities. And, normally, new people enter the CRM as a “Lead.” In Salesforce, you can “map” data between the Lead object and the Contacts and Opportunities object. This means that, when a Lead becomes a Contact and generates an Opportunity, the attribution data can automatically get copied from the Lead to the Contact and Opportunity objects.
*It is possible to set up attribution in non-traditional CRM architectures (e.g. utilizing only the Contact object with no Lead object, or utilizing Custom Objects). If you’re concerned about this, please reach out and we’ll be happy to talk through it.
Leads become Contacts and Opportunities?
While this is obvious to many of our readers, the attribution implications of the lead conversion process are significant, so we’d be remiss if we didn’t spell it all out.
The process by which a Lead becomes a Contact and creates an Opportunity is called “Lead Conversion”, and it works like this:
- When a Lead reaches a certain threshold of engagement (usually, they’re in personal contact with a salesperson), the salesperson manually hits the “Convert” button in the CRM.
- When the Lead is converted, a couple of things happen to it:
- It is added as a new record in the “Contact” object, with all of the fields mapped between Lead and Contact passing data. That Contact MUST be attached to an account (e.g. John Doe would be attached to the ExampleCo Account).
- The Lead is “frozen” as a “Converted Lead” in the Lead object. It can’t be easily edited. Contacts CANNOT move backward into being leads – once converted, always converted.
- Additionally, when the lead is converted, Salesforce will ask the salesperson if they want to create an associated opportunity.
- If the “Converted” Contact is not a likely buyer, the salesperson may decline to create an opportunity.
- However, usually the Converted Contact is interested in buying something, and so the salesperson creates the opportunity at this point in the conversion process. Because the opportunity is created during conversion, any mapped data between lead and opportunity will also pass automatically into the opportunity object.
- It is important to note – if an opportunity is created OUTSIDE of the conversion process (e.g. the salesperson exits the conversion, goes to the opportunity object and hits “New Opportunity”, it will NOT capture mapped attribution data.
Once you have data attached to leads, contacts, and opportunities in the CRM, we can then run reports that can answer important questions like:
- “How much revenue did we generate from LinkedIn Sources?
- How many opportunities did we create from Social Media?
- How many leads did we create from paid advertising?
- How much revenue is each new organic visitor worth?”
KPI Reporting
At this point, the CRM is now collecting leads and opportunities with attribution data. This data can be exported from Salesforce into an Excel or CSV worksheet.
*Unfortunately, Salesforce only lets you export reports individually by object. So, there is no single report for both leads and opportunities. However, you *can* run a “Leads with Converted Lead Information” report which WILL show all of the opportunity attribution information from opportunities created via the lead conversion process. If an opportunity is created manually, though, it will NOT be present in that report.
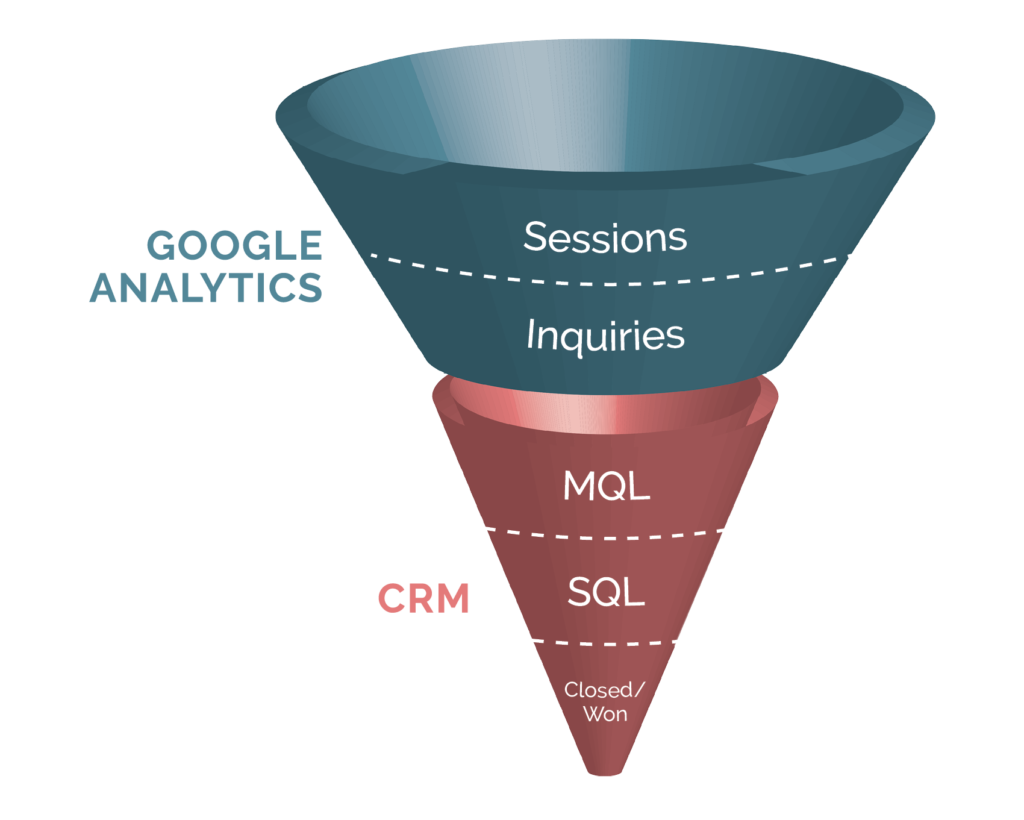
These reports are then loaded into the KPI Report Template raw data section. Using the client’s customized parameters (e.g. Lead Status, Lead Score, Mintigo Score, etc.) for lifecycle stages (e.g. MQL, SQL, etc.), we can then report on how many opportunities were created, how many leads were created, how much revenue was created, etc from each source, medium, campaign, content, keyword, and landing page. These reports are generated using Excel/Google Sheets formulas that count how many leads and opportunities have either First Touch, Last Touch, or both First and Last Touch for any given source, medium, campaign, content, and landing page.
Currently, the Excel/Google Sheets formulas are double counting records who have both first-and-last touch with the same source/medium/campaign/content/keyword/landing page, but we are expecting to fix this shortly in the next release of the KPI report infrastructure.
Additional Attribution Options
There are a significant number of models for weighting the value of marketing attribution. In the DRA model above, both first and last touch are weighted equally. However, what if you wanted to say that last touch is worth 3x as much as 1st touch? In this case, you’d weight 75% to Last Touch and 25% to first touch.
Or, what if you wanted to count touches in between? Let’s say that this very plausible scenario happens:
- Jane Doe arrives to the website via a paid ad. They submit a form, and both First Touch and Last Touch data are set as Source = Google and Medium = cpc.
- The next day, Jane Doe googles the brand name and arrives back on the site via a google search. They download a resource. Their Last Touch information updates to Source = Google and Medium = organic
- The day after that, Jane Doe clicks on an email link and arrives back at the site, filling out the contact us form. Their Last Touch information updates to Source = Marketo and Medium = Email. She ends up becoming a customer for $10,000.
With DRA attribution, the middle-touch, the Organic touch that led to the resource download, gets overwritten and removed forever. We can’t report based on it, and we deprive the organic team of some credit for helping drive this lead. Some value ideally would be attributed to this middle touch!
This is called “Multi-touch attribution”, and is past the scope of DRA”s attribution pixel. However, third party attribution tools like Bizible, Full Circle Insights, and Lean Data can capture this type of data. And, they will allow you to model the weighting of these touches however you want. Equal distribution means that Google/CPC, Google/Organic, and Marketo/Email would each be worth $3,333 each in this case. You could weight last touch 50% and Google/cpc and Google/organic would each be worth $2500, while Marketo/email would be worth $5000.
There is no singular “best” attribution model, though multi-touch weighted attribution provides the most accurate picture of the value of each marketing source and medium throughout the buyer journey.
As Digital Reach continues to work with larger and more sophisticated organizations, they will expect us to have significant understanding of multitouch attribution, how it works, and how we can use it to customize our reporting. We will continue to grow as an agency to improve our skills in this area. However, for many clients, simply getting ANY attribution working properly is such a large and important win for their marketing organization, that the DRA Attribution Pixel is a huge value add and major selling point for our B2B clients.
Thanks for reading this attribution guidebook!