


So, you’ve spent all this time working on creating the perfect site in hopes it will resonate with your audience and ultimately convert them, making you lots of money, and everyone will live happily ever after. Right?
Well, what’s your plan to track your site’s success with its users? Have you benchmarked your data and set feasible goals? Do you know where to find said data? If these questions cause you to break out in a cold sweat, you’re in the right place.
In this blog post, we’ll walk you through 3 areas of Google Analytics imperative to tracking and understanding both your audience and your site’s performance.
1. Audience Reports
From demographics and devices to location and language, this area can be a secret weapon on everything from tweaking personas to driving content strategy.
TL;DR Your demo data can help drive content strategy for language changes on important pages or even help shape the content calendar for your blog. Location data can motivate SEO strategies for location-based pages or international SEO optimizations on-site. Finally, knowing what devices your audience uses the most can push improvements to the user journey you’re providing. Below, we’ll get to the nitty gritty of these sections.
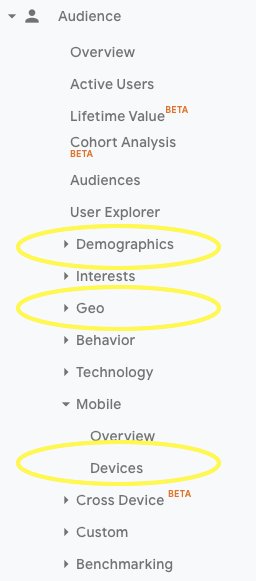
Demographics – Depending on your industry, gender may not be a major target for your personas. Age, however, can be a huge indicator your site is attracting the right group of people… or not.
Ex. You know your audience is around the 45-54 range, but the majority of site visitors are 20-somethings. You will need to adjust your language and keyword targeting.
Geo – Location can be a major player in your data analysis. Are your locally targeted strategies actually paying off? Did that international merger finally help you reach a global audience? Additionally, location can help you see if you’re receiving spam or bot traffic. US-based but seeing an influx from international sources? This can be a major sign something is not quite right and intervention is needed.
Pro-tip: Ensure Google’s setting “Exclude all hits from known bots and spiders” is enabled. This will help weed out a good majority of spam/bots or let you know a custom filter is needed.
Devices – Having accurate data on how users are consuming your information can be a game-changer, especially when creating strategy around the user’s journey. If your audience is more on-the-go, mainly using mobile devices, make sure you’re giving them quick, easy ways to convert.
Pro-tip: When building your site, always think “mobile first.” This will set you up for success with Google (they index the mobile version of your site) and, of course, your audience.
2. Behavior Reports
Behavior reports are helpful for drilling down into the granular page-by-page data.
TL;DR Behavior reports give you a better understanding for how your audience is interacting with individual pages. It helps you see the natural on-site journey your users take and what pages resonate with them the most. This data can help you improve navigation, content, and technical strategy.
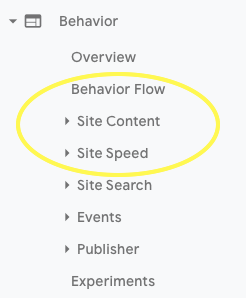
Behavior Flow – Visualize the path your user takes on the site. From the most popular next pages to the highest drops, track what pages are successful on your user’s journey.
Site Content – This is helpful for breaking down the metrics for each page individually. Whether you’re looking at the value to the user or testing what content works best, this area is pivotal to making important decisions for each page within the user’s journey on your site.
Pro-tip: For a detailed breakdown of a user’s journey to-and-from a specific page, check out the “Navigation Summary” section.
Site Speed – Check what pages are causing a poor user experience by getting granular breakdowns of the pages with the worst speeds. You can even see Google’s suggestions for improvements.
3. Conversion Tracking
Goal and event tracking through GA can do some magical things for tracking success on your site.
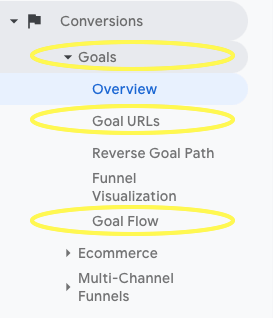
TL;DR If you’re looking to evangelize your digital efforts, you better have your on-site goals tracked through Google Analytics. You can track on-site actions from form fills to scroll depth. This is your crystal ball for conversion rate optimization.
Goals vs Events – Both are pivotal to tracking the success (or failure) of your site and on-site strategies, but it’s important to understand the distinction between the two when you set out to track data.
Ex. Goal: A destination (users that go to our Contact Us page) or duration (users that stay past 1:30).
Ex. Event: An on-site completion like a form fill.
Goal URLs – What pages see the most conversions. This data is great to gauge what pages are more important to the user, what pages are successful enough to use as inspiration for future pages, and what pages give you the best chance when put in front of your most important users.
Goal Flow – This provides step-by-step tracking of what the users did before ultimately converting. Have you ever wanted to be a fly on the wall during your user’s journey? This is your front row seat. (see also: navigation summary in section 2).

How to use these reports to drive strategy
Leverage the data in GA to drive home your points in a presentation, improve pages that are poor performers, and even enhance your CTA placement and language. From proving the success/failure of a specific strategy to guiding high-level strategies like user journey improvements, Google Analytics will be a go-to tool in your repertoire.
Looking for a data-driven strategy? We’re the experts you’ve been looking for.